
In order to give your child the best possible start, it is important to choose the right place for them to grow up. This report provides an in-depth look at the best states in the United States to raise a child.
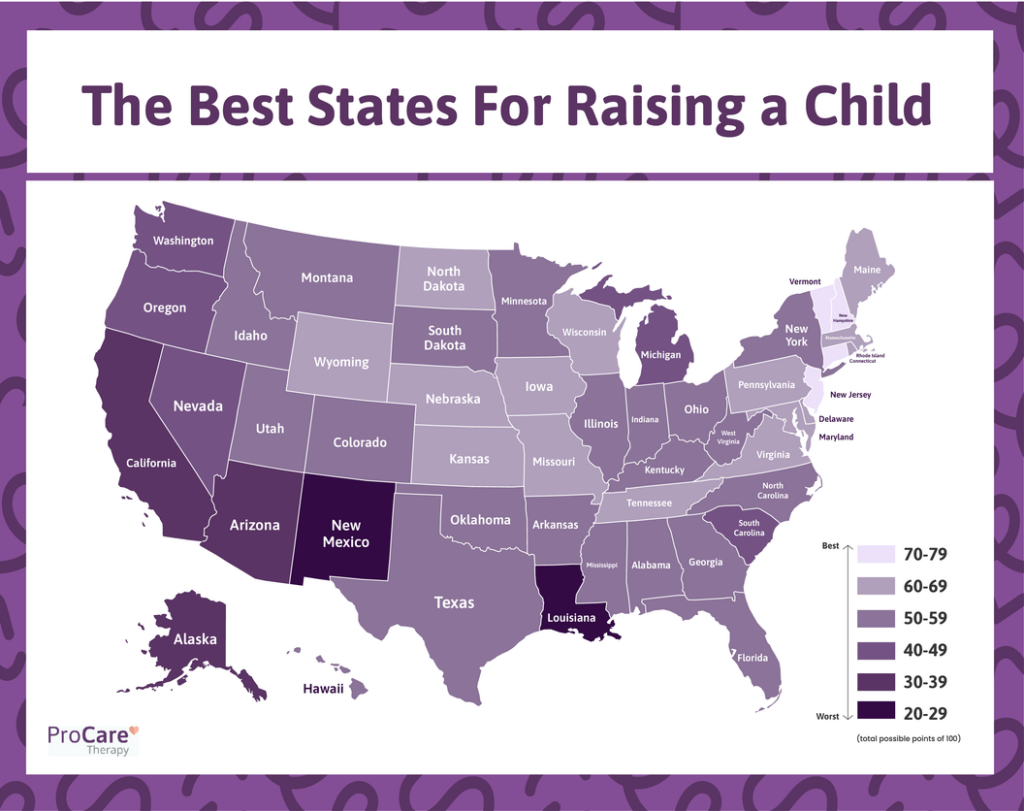
ProCare Therapy has released its 2023 Best Places to Raise a Child Report, which ranks all 50 states on eight factors that impact children. The report found New Jersey (1), Vermont (2), and New Hampshire (3) are the top-ranking states, while Louisiana (50) and New Mexico (49) are the worst.
In order to give your child the best possible start, it is important to choose the right place for them to grow up. This report provides an in-depth look at the best states in the United States to raise a child.
Instead of ranking states simply by the educational outcomes or based on general population surveys, ProCare Therapy worked with child health professionals to consider a wider range of factors that impact childhood outcomes. The categories used to determine the overall best and worst places for raising children include:
- High school graduation rates
- Teacher-per-student ratios in elementary and secondary school classrooms
- Pre-COVID-19 National Assessment of Educational Progress (NAEP) reading assessment results
- Childcare cost burden, which is the percent of the median household income that goes to childcare costs
- Access to childcare
- Percentage of population that is a child
- Access to healthy food
- Air quality
The top-ranking states best meet the environmental, educational, and social factors ideal for raising children.
The Top 10 Best States for Raising Children
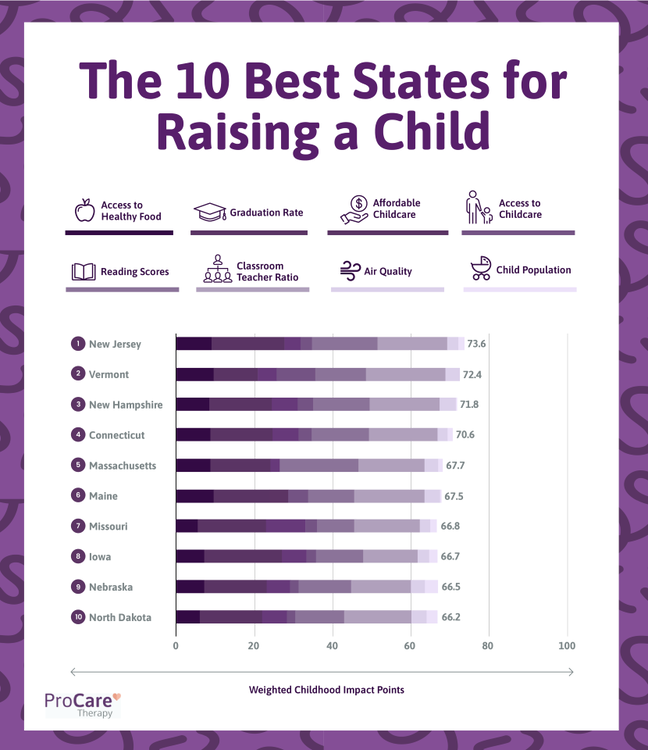
The report found New Jersey to bethe overall best state to raise a child in, receiving 73.6 out of a total 100 points possible across the eight categories.
New Jersey has the second-highest reading scores and the second-best teacher-to-student ratio of all 50 states. While the state ranked 30th for air quality, New Jersey tops the rankings with the fifth-highest high school graduation rate and the sixth-best access to healthy foods.
Residents of Vermont (2) have the best access to childcare services in the nation and the second-best access to healthy foods for their children. In Vermont classrooms, students receive the support they need with the lowest student-per-teacher ratio in the nation.
New Hampshire (3) is the third-best state for raising a child as it lands in the top ten states for multiple categories, including air quality, access to healthy food, state reading scores, and classroom student-per-teacher ratios.
Compare the States
Coming in last, Louisiana (50) ranked on the lower end for many of the categories considered. Louisiana had the third-lowest reading scores and access to healthy food, the fourth-lowest high school graduation rate, and the sixth-worst childcare cost burden—with 32% of household income required for childcare expenses.
New Mexico (49) residents have the most limited access to healthy foods, with the 13% of the population living in a food desert. The state has the lowest high school graduation rate and a significant childcare cost burden, with 33% of household income required for childcare.

- New Jersey
- Vermont
- New Hampshire
- Connecticut
- Massachusetts
- Maine
- Missouri
- Iowa
- Nebraska
- North Dakota
- Virginia
- Wisconsin
- Maryland
- Wyoming
- Pennsylvania
- Rhode Island
- Kansas
- Tennessee
- Delaware
- Kentucky
- Hawaii
- South Dakota
- New York
- Texas
- Minnesota
- Arkansas
- Utah
- North Carolina
- Illinois
- Indiana
- Colorado
- Montana
- Florida
- West Virginia
- Oklahoma
- Mississippi
- Ohio
- Georgia
- Idaho
- Alabama
- South Carolina
- Washington
- Nevada
- Oregon
- Michigan
- California
- Alaska
- Arizona
- New Mexico
- Louisiana
The Importance of Early Childhood Support
ProCare Therapy commissioned this report to elevate conversations about how parents and communities can best support children physically, mentally, and socially. The research brings to light how the educational outcome of children—including graduation rates and state reading scores—starts early in the classroom, with affordable, accessible childcare and ideal student-per-teacher ratios.
Here at Procare, we hope these findings help families understand considerations that can be made when deciding where to raise children to ensure everyone has the opportunity to provide their kids with the emotional and educational support needed for a happy, healthy childhood.
School therapy professionals directly support students in communities nationwide. These vital roles—including behavioral specialists, special education teachers, school psychologists, teachers, and more—make sure students receive the proper educational and emotional support that they need. If you’re looking for a career that makes a difference, browse school therapy jobs with ProCare today.
Methodology
To most accurately calculate the final ranking, ProCare Therapy professionals determined the categories and how each should be weighted based on the influence each category had on positive childhood outcomes. The range of values for each childhood factor category was established and used to create a scale which each state was distributed against, receiving a value. This adjusted value determined how the state ranked for each category. Each state’s weighed value for all eight categories was added to determine the final ranking.
Categories, category weight, and sources include:
- High School Graduation Rate (20% weight) – Public High School Graduation Rates. Retrieved from the National Center for Education Statistics (2022). Public High School Graduation Rates. Condition of Education. U.S. Department of Education, Institute of Education Sciences.
- Teacher-per-Student Ratio (20% weight) – Average number of students per teacher in public elementary and secondary school classrooms. Retrieved from the U.S. Department of Education, National Center for Education Statistics, Common Core of Data (CCD), “State Nonfiscal Survey of Public Elementary/Secondary Education.”
- Reading Scores (20% weight) – Average fourth-grade student reading scores from the most recent, publicly available, pre-COVID-19 National Assessment of Educational Progress (NAEP) reading assessment results, which assess students’ reading comprehension skills. Retrieved from U.S. Department of Education, National Center for Education Statistics, National Assessment of Educational Progress (NAEP).
- Childcare Cost Burden (10% weight) – Child care costs for a household with two children as a percent of median household income. Retrieved from The Living Wage Calculator; Small Area Income and Poverty Estimates.
- Access to Childcare (10% weight) – Number of childcare centers per 1,000 population under 5 years old. Data from 2010-2022 retrieved from Homeland Infrastructure Foundation-Level Data (HIFLD).
- Percent of Child Population (5% weight) – Percent of the population under the age of 18. Retrieved from U.S. Census Bureau, Population Estimates Program (PEP). U.S. Census Bureau, American Community Survey (ACS).
- Limited Access to Healthy Foods (10% weight) – Percentage of the population who are low-income and do not live close to a grocery store in 2019. Retrieved from USDA Food Environment Atlas.
- Air Pollution (5% weight) – Average daily density of fine particulate matter in micrograms per cubic meter (PM2.5). Retrieved from the CDC’s National Environmental Public Health Tracking Network.