
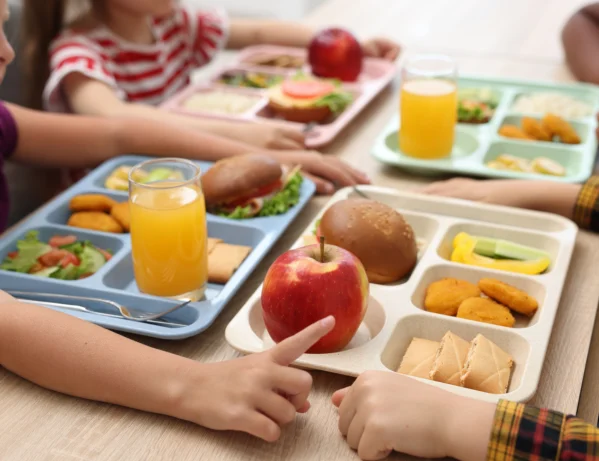
School meals are about much more than what is on the tray. For millions of students across the country, breakfast and lunch at school provide consistent access to food during the day, helping children stay fueled, focused, and ready to learn.
As part of ProCare Therapy’s ongoing commitment to supporting the health, well-being, and success of students, we created the 2026 State of School Lunch Report to explore how school meal programs compare across the United States.
This year’s report takes a broader look at the school lunch landscape, examining not only access to locally sourced foods, but also how effectively states reach students through school lunch and breakfast programs, expand access to free meals, and take advantage of programs designed to remove barriers for families.
After analyzing data for all 50 states and Washington, D.C., Vermont ranks No. 1 in the nation for school meals in 2026, followed by New Mexico, New York, West Virginia, and Washington, D.C.
The State of School Lunch in 2026
To determine which states have the strongest school meal programs, ProCare analyzed five factors related to meal access, participation, and food offerings:
- School Lunch Reach: How average daily participation in the National School Lunch Program compares with the state’s school-age population.
- School Breakfast-to-Lunch Reach: How many students participate in the School Breakfast Program relative to participation in school lunch.
- Community Eligibility Provision Adoption: The percentage of schools in the 2025–26 Community Eligibility database participating in CEP, a federal provision that allows eligible high-need schools to serve breakfast and lunch to all students at no charge.
- Schools Serving Local Foods: The percentage of schools represented by responding school food authorities that served locally sourced foods.
- Healthy School Meals for All: Whether a state currently has a statewide policy providing breakfast and lunch at no charge to all students, regardless of household income.
Together, these factors provide a picture of how effectively states are connecting students with school meals while supporting broader access to fresh, local food.
Which States Lead the Nation for School Meals?
Vermont takes the top spot in the 2026 State of School Lunch Report with a score of 83.01 out of 100, performing consistently well across nearly every factor included in the index.
New Mexico follows closely behind with a score of 82.19, while New York ranks third at 79.18. West Virginia and Washington, D.C., round out the top five.
Several findings stood out across the rankings:
- Vermont remains a national leader. The state combines high school lunch reach with 99.3% Community Eligibility Provision adoption, widespread use of local foods, and statewide Healthy School Meals for All.
- All nine states currently implementing statewide Healthy School Meals for All policies rank within the top 12. Those states are California, Colorado, Maine, Massachusetts, Michigan, Minnesota, New Mexico, New York, and Vermont.
- New Mexico has the highest CEP adoption rate in the index, at 100%. It also has the third-highest breakfast-to-lunch participation ratio.
- West Virginia leads the country in breakfast reach, serving approximately 79.5 school breakfasts for every 100 students participating in school lunch.
- North Dakota has the highest school lunch reach ratio, with average daily lunch participation equivalent to approximately 68.8 participants for every 100 residents ages 5–17.
- Hawaii leads for locally sourced food, with 99.6% of schools represented by responding school food authorities serving local foods. However, its No. 38 overall ranking illustrates why the 2026 report considers access and participation alongside local-food initiatives.
- At the other end of the rankings, New Hampshire, Wyoming, Idaho, Alaska, and Utah make up the bottom five overall. New Hampshire ranks last, driven in part by the lowest CEP adoption rate in the index.
Ranked: The 2026 State of School Lunch Report
See how all 50 states and Washington, D.C., compare for school meal access, participation, and local-food support.
| Rank | State | Score |
| 1 | Vermont | 83.01 |
| 2 | New Mexico | 82.19 |
| 3 | New York | 79.18 |
| 4 | West Virginia | 79.07 |
| 5 | Washington, D.C. | 77.72 |
| 6 | Massachusetts | 76.59 |
| 7 | Maine | 75.80 |
| 8 | Kentucky | 72.37 |
| 9 | Michigan | 71.72 |
| 10 | California | 70.11 |
| 11 | Minnesota | 67.96 |
| 12 | Colorado | 66.46 |
| 13 | South Carolina | 66.16 |
| 14 | Delaware | 65.62 |
| 15 | Georgia | 64.57 |
| 16 | Virginia | 64.11 |
| 17 | Alabama | 62.73 |
| 18 | Louisiana | 62.25 |
| 19 | Texas | 60.33 |
| 20 | Tennessee | 59.67 |
| 21 | Oregon | 58.36 |
| 22 | Arkansas | 54.20 |
| 23 | Connecticut | 53.22 |
| 24 | North Carolina | 53.21 |
| 25 | Florida | 52.23 |
| 26 | Pennsylvania | 51.93 |
| 27 | Rhode Island | 50.28 |
| 28 | Indiana | 49.53 |
| 29 | Mississippi | 48.59 |
| 30 | Ohio | 48.00 |
| 31 | Nevada | 47.72 |
| 32 | North Dakota | 47.69 |
| 33 | Washington | 47.14 |
| 34 | Iowa | 47.05 |
| 35 | Missouri | 46.34 |
| 36 | Nebraska | 45.94 |
| 37 | Arizona | 45.57 |
| 38 | Hawaii | 44.59 |
| 39 | Kansas | 43.04 |
| 40 | Oklahoma | 42.45 |
| 41 | Wisconsin | 41.68 |
| 42 | Maryland | 41.65 |
| 43 | Illinois | 41.43 |
| 44 | New Jersey | 38.34 |
| 45 | South Dakota | 37.40 |
| 46 | Montana | 36.45 |
| 47 | Utah | 36.25 |
| 48 | Alaska | 30.74 |
| 49 | Idaho | 24.40 |
| 50 | Wyoming | 24.38 |
| 51 | New Hampshire | 17.05 |
What Sets the Top Five States Apart?
The highest-ranking states demonstrate how a combination of participation, accessibility, and local-food initiatives can contribute to a strong school meal system.
1. Vermont
Vermont earns the No. 1 spot with one of the most well-rounded performances in the country.
- 99.3% CEP adoption
- Approximately 62.3 breakfast participants for every 100 lunch participants
- 78.6% local-food rate
- School lunch reach equivalent to 64.9 participants per 100 residents ages 5–17
- Statewide Healthy School Meals for All
Rather than relying on one standout factor, Vermont performs near the top across nearly every measure, helping it hold onto the No. 1 position in ProCare’s annual report.
2. New Mexico
New Mexico comes within one point of the top spot and leads the nation in one particularly important measure: Community Eligibility.
- 100% CEP adoption, the highest in the country
- Approximately 68.8 breakfast participants per 100 lunch participants, the third-highest ratio nationally
- 75.8% local-food rate
- School lunch reach of approximately 62.3 per 100 school-age residents
- Statewide Healthy School Meals for All
New Mexico’s results point to a school meal system built around removing barriers to participation, particularly for students attending schools eligible for Community Eligibility.
3. New York
New York ranks third after pairing widespread free-meal access with strong local-food participation.
- 99.4% CEP adoption, the third-highest rate in the index
- 85.7% of schools represented by responding SFAs serve local foods
- School lunch reach of approximately 61.5 per 100 school-age residents
- Statewide Healthy School Meals for All
New York began implementing statewide Healthy School Meals for All during the 2025–26 school year, joining the growing group of states offering free breakfast and lunch to all students.
4. West Virginia
West Virginia stands out as the highest-ranking state without a statewide Healthy School Meals for All policy. Its biggest strength is breakfast access:
- Approximately 79.5 breakfast participants for every 100 lunch participants — the highest ratio in the country
- 88.8% CEP adoption
- 86.3% local-food rate
- School lunch reach of approximately 64.3 per 100 school-age residents
West Virginia demonstrates how strong participation in existing federal school nutrition programs can help schools reach students throughout the school day.
5. Washington, D.C.
Washington, D.C., rounds out the top five with especially strong results in breakfast participation, Community Eligibility, and local foods.
- Approximately 78.3 breakfast participants per 100 lunch participants, second-highest in the ranking
- 97.1% CEP adoption
- 90.1% local-food rate, third-highest in the index
- School lunch reach equivalent to approximately 59.6 participants per 100 residents ages 5–17
D.C.’s performance shows how multiple school meal strategies can work together to expand access even without a statewide Healthy School Meals for All designation.
What the 2026 Findings Tell Us About School Meals
The 2026 results reinforce that a strong school meal program is about more than simply offering lunch.
Access matters. So does making breakfast available, reducing the administrative and financial barriers that may prevent students from receiving meals, and connecting schools with fresh foods from local producers.
Community Eligibility has become an increasingly important part of that picture. During the 2025–26 school year, 55,362 schools participated in CEP, and 74.9% of eligible schools nationwide had adopted the program, according to the Food Research & Action Center.
There is still considerable variation between states, however. While New Mexico reaches 100% CEP adoption among schools included in the database, New Hampshire sits at just 2.1%. Breakfast reach also ranges considerably, from nearly 80 breakfasts for every 100 lunches in West Virginia to roughly 22 in Utah.
Those gaps demonstrate that simply having federal school meal programs available does not necessarily mean students access them at the same rate everywhere.
Supporting Healthy, Successful Students
Every child deserves the opportunity to arrive in the classroom ready to learn. Nutritious and accessible meals are one part of creating a school environment where students can focus on learning, building relationships, and reaching their full potential.
The 2026 State of School Lunch Report highlights states that are finding different ways to strengthen their school meal systems, while also identifying opportunities to reach more students through breakfast, lunch, Community Eligibility, and local-food initiatives.
At ProCare, we know supporting students takes an entire school community. From special education teachers and school nurses to speech-language pathologists, school psychologists, occupational therapists, and other school professionals, dedicated educators and specialists play an important role in helping children thrive.
Explore school-based career opportunities—or find high-quality support specialists for your school—with ProCare today to help make an impact on students in communities across the country.
The State of School Lunch 2026: Data Sources and Methodology
ProCare Therapy analyzed all 50 states and Washington, D.C., using data from the U.S. Department of Agriculture, U.S. Census Bureau, and Food Research & Action Center.
Each state received a score out of 100 based on five weighted factors:
- School Lunch Reach — 30%: FY2025 average daily participation in the USDA National School Lunch Program was divided by the state’s 2025 civilian population ages 5–17. School-age population estimates came from the U.S. Census Bureau’s Vintage 2025 population estimates. USDA’s current Child Nutrition Program data are dated July 10, 2026, and FY2025 figures are preliminary.
- School Breakfast-to-Lunch Reach — 20%: FY2025 average daily participation in the USDA School Breakfast Program was divided by FY2025 average daily National School Lunch Program participation. This measures breakfast participation relative to the reach of school lunch. USDA Child Nutrition Program data are dated July 10, 2026, with FY2025 data considered preliminary.
- Community Eligibility Provision Adoption — 20%: The number of schools participating in CEP was divided by all schools included in FRAC’s 2025–26 Community Eligibility eligibility and participation database for each state. Nationally, 74.9% of eligible schools adopted CEP during the 2025–26 school year.
- Schools Serving Local Foods — 20%: The percentage of schools represented in responding school food authorities that served local foods, using the USDA’s latest national Farm to School Census. The 2023 Farm to School Census reflects activity during the 2022–23 school year.
- Healthy School Meals for All — 10%: States received the full 10 points if they currently implement a statewide policy offering free breakfast and lunch to all students, regardless of household income. Nine states currently meet this definition: California, Colorado, Maine, Massachusetts, Michigan, Minnesota, New Mexico, New York, and Vermont.
For the four continuous factors, each state’s raw value was normalized using a min-max scoring method and multiplied by the corresponding weight. States with Healthy School Meals for All received 10 points for that factor; all other states received zero. The weighted scores were then combined to determine each state’s final score out of 100.
Methodology notes:
- Washington, D.C., was included as a 51st jurisdiction.
- The School Lunch Reach figure is a standardized participation ratio using the school-age population as a denominator; it should not be interpreted as the literal percentage of enrolled students eating school lunch.
- FY2025 USDA lunch and breakfast participation data are preliminary and may be revised.
- The 2026 methodology was expanded to place greater emphasis on meal access and participation than previous editions of ProCare Therapy’s State of School Lunch Report. Because the factors and weights have changed, year-over-year ranking changes should not be interpreted as direct measures of improvement or decline.
- The index is intended to compare the overall strength and accessibility of state school meal systems. It does not measure the nutritional content of every meal served within a state.